Monday, March 14, 2011

The ties that bind - healthy eating policies, agriculture, the economy, and population health

I am no economics expert nor claim to have all that much knowledge about ‘the economy;’ I have troubles simply deciding where to invest. However, from a population health perspective, I was so intrigued with this recent Lancet article in the series “Chronic Diseases and Development” that I wanted to share it with it you. It highlights the inextricable and complex connections between the global economy (specifically agri-trade), our food consumption patterns, and health – something that is only beginning to be realized. The paper also shows what can happen from an equity perspective – the global winners and losers of adopting healthy eating recommendations.  

There is no doubt that the way we have been eating for the last 30 years, has contributed in some way to the rise in obesity and chronic diseases like diabetes and cardiovascular disease. In fact, middle and low-income countries are now experiencing the ‘nutrition transition’ – a switch from primarily infectious to chronic diseases.
The authors assert that the reduction of the burden of chronic disease by healthier eating necessitates changes in agriculture, and manufacturing and trade world-wide. They first conducted a systematic review, to determine the most prevalent dietary recommendations developed by expert panels internationally (which was interesting in-and-of-itself and highlighted here) to inform their analysis. In short, the authors found broad consensus on the recommendations outlined below:
  • Eat large amounts of cereals, veggies, fruits, and pulses 
  • Try to eat >400 g/d of veggies and fruit 
  • Limit the amount of red and processed meats 
  • Avoid trans fats, saturated fats, and added sugars 
  • Try to get most of protein from plant sources 
  • Try to limit salt to < 5 g/d

The authors then focused on the population health impact of adopting saturated fat recommendations – selected because it has well established links to cardiovascular disease. Important to note here is that the major sources of saturated fat are from animals. What would happen then to the risk of cardiovascular disease in populations that adopted World Health Organization (WHO) recommendations to decrease saturated fat intake to 10% or less of daily caloric intake? The authors compared the UK and Brazil; the UK selected for its high quality population-level dietary data, and high-income status, and Brazil because it is one of the world’s largest exporters of chicken and beef, and a rapidly developing country that keeps 70% of its meat and poultry for domestic consumption.
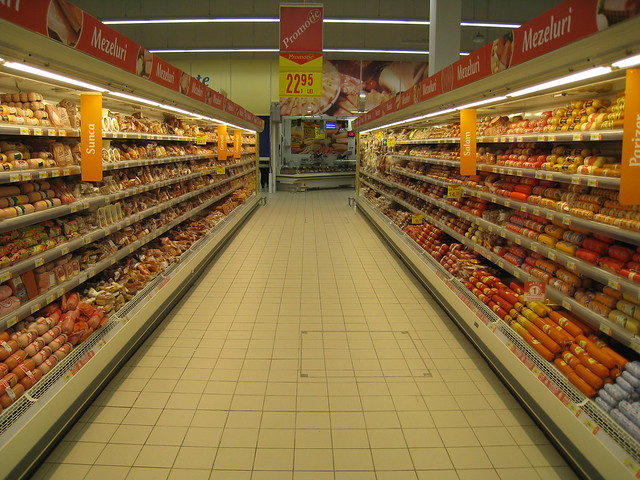

The meat aisle at Carrefour. Photo credit: J. Michalski


Using present intakes and targeted reductions (to meet recommendations), ischemic heart disease morbidity and mortality as outcomes, and estimated exposure (saturated fat)–disease effect sizes from a meta-analysis (a compilation of the results from 11 cohort studies), the authors estimated that:
  • In the UK, a 22% reduction in population dietary saturated fat consumption could reduce the years- of- life- lost from ischemic heart disease by 7% and years-of-life lived with disability by 4%; 
  • In Brazil, these figures are 7% (showing that Brazilians on average don’t consume as much saturated fat at Brits), 3%, and 2% respectively

Okay, this seems intuitive; if a population’s consumption patterns are not too far above unhealthy, then adopting healthy recommendations likely won’t result in a big effect on health (Brazil) as compared to a population that is comparatively more unhealthy (UK). But Brazil is a developing country, where the majority of its Gross Domestic Product (GDP) is based on agriculture (which often can be said of low and middle income countries), whereas the UK is a high income country that eats a whole lot of meat. See where this is going? What could the adoption of healthy recommendations (like eating less meat to reduce saturated fat intake) by high income countries do to the global economy, and in particular low and middle income countries?

The authors approached this question using computable general equilibrium models, using again, the UK and Brazil as comparators. I can’t comment on the validity of this technique since I am not an economist, but I did find the the different health policy strategies (or ‘shocks’) and their respective outcomes on GDP quite eye-opening. The different shocks included looking at what would happen if consumption from all animal sources fell, just meat, and just dairy, and comparing the effects on UK domestic demand, Brazil domestic demand, Brazil international demand, and a combined effect for Brazilian domestic and international demand (a UK international demand was not modeled - not deemed plausible as they are not major exporters).

The different shocks mainly affect GDP in terms of:

  • Labour - there is an increase in supply and productivity as there are more healthy workers (because of eating better - based on authors' previous estimates for the UK and Brazil); 
  • Domestic consumption of agricultural products with decreasing production of meat and dairy 
  • Imports and exports of agricultural products with decreasing production of meat and dairy

The effects on GDP differed substantially by dietary strategy (shock) and by scenario. Reducing dietary intake from all animal sources had a fairly small effect on GDP in both the UK and Brazil. However, reducing intake from dairy sources had a large negative impact in both countries (-22% to almost -30%). Reducing meat intake only had the largest negative impact for Brazil - specifically when considering a combined domestic-international effect.

A farm in Brazil. Photo credit: AJ Lopes
Important things to keep in mind about this study (among others which are discussed in the paper itself):
  • First, these are estimates, kind of like a simulation 
  • The authors only considered ischemic heart disease; there are many other chronic diseases related to diet such as obesity, diabetes, and cancer 
  • Dietary data from Brazil was not as current or as high quality as that from the UK 
  • The added positive health effects of replacing animal source foods with plant-based sources was not considered 
  • The authors were unable to adequately model how the agricultural sector could adapt - say by switching from exportation of animal sources to plant-sources 
  • The effects of time could not be modeled

Nonetheless, this study lends insight into the complexities of population health and population health interventions. High income countries may have more to gain and less to lose than middle and low income countries, depending on the policy implemented. A global awareness of the interconnectedness of the economy, agriculture, food consumption and health is needed if we are to develop strategies that are sustainable; that is, balancing social, economic, and environmental interests. An example of just such an approach may be a policy to reduce food consumption from all animal sources; this was estimated to have a much smaller impact on GDP than reducing meat sources only, and is likely to still be beneficial in terms of health and the environment. Certainly striving to make diets sustainable world-wide will require further research (like this study) that is inter-disciplinary in nature.


ResearchBlogging.org

Lock, K., Smith, R., Dangour, A., Keogh-Brown, M., Pigatto, G., Hawkes, C., Fisberg, R., & Chalabi, Z. (2010). Health, agricultural, and economic effects of adoption of healthy diet recommendations The Lancet, 376 (9753), 1699-1709 DOI: 10.1016/s0140-6736(10)61352-9

Sunday, March 6, 2011

Health by Design 2: The Fused-Grid Neighbourhood Street Layout

Remember that neighbourhood street layout I was talking about way back when? The Fused-grid? Well finally we’ll get to see how well it does in terms of sustainability and health in this week’s post.

To recap, the Fused-grid is a synthesis of the curvilinear, loop and lollipop layout and the traditional gridiron street pattern. It increases connectivity for pedestrians (and potentially cyclists) by providing green spaces in the centres of neighbourhood quadrants. It also preserves the discontinuous, meandering driving nature of the conventional subdivision, which has been shown to increase safety for residents relative to living in a grid area. Mixed-use areas are located along arterial roads and are accessible from any neighbourhood quadrant in about 10 min or less. For a more in-depth description see my previous post: Health by Design: Part 1, or visit the creator’s (Fanis Grammenos') website.     

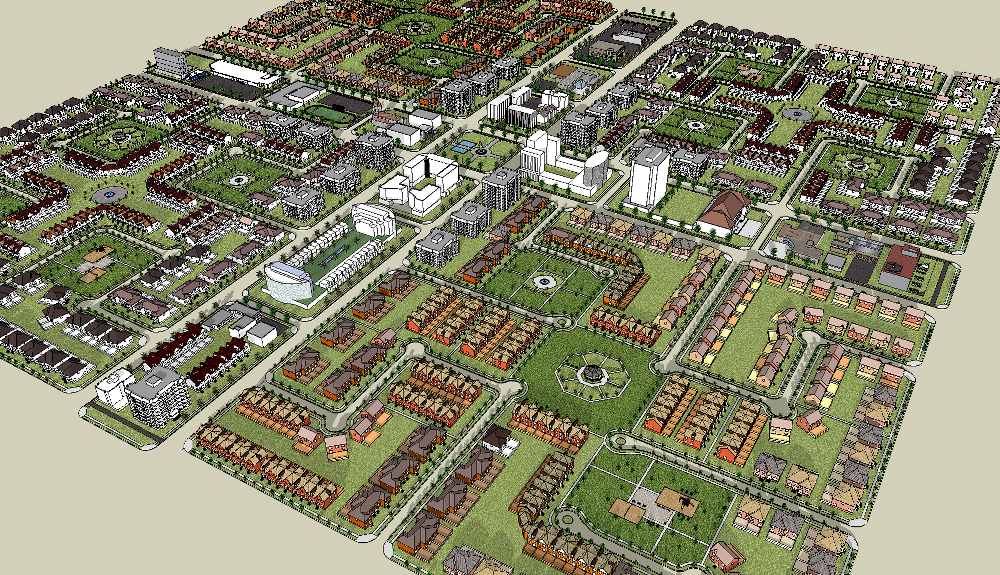
A Fused Grid district with four quadrants and a mixed use zone

The quality and efficiency of the Fused-grid has been tested in a number of studies variously involving  Fanis, The Canadian Mortgage and Housing Corporation, graduate students of Canadian Universities, and Lawrence Frank (Canadian Bombardier Chair of Sustainable Transportation). These studies compare the Fused-grid to alternative street layouts (usually the traditional gridiron and conventional subdivision) to determine if the Fused-grid performs better in terms of vehicular traffic performance and pollution, travel behaviour, safety, and water management. All but one study use simulations and control areas such as Barrhaven (ON) and Stratford (ON) (a technique often used in geography and planning research) to determine how changes in urban form can influence relevant outcomes. However, one study conducted in the Puget Sound Region of the U.S. did use epidemiological methods to assess the cross-sectional (measured at one time point) association between urban form and travel behaviour. Additionally, a developer in Calgary, Alberta has implemented the Fused-grid layout in one of their developments - offering further insight into its applicability.       
So what does this collective body of evidence show?

For a start, the Fused-grid reduces traffic delay more consistently than the gridiron and subdivision layouts and allows for better flow (and possibly less pollution) as the number of residential houses and places of employment increase in an area (1). In fact it has been estimated that pollution exposure would be lower in Fused-grid areas compared to gridiron, subdivisions and new urbanism developments (2).


Figure 1. Comparison of pollution index and number of pedestrian encounters 
between different neighbourhood street layouts, provided by F. Grammenos 
and adapted from Jin, 2010

During peak travel times (rush hour), the Fused-grid was shown to restrict total vehicle kms traveled to just 5% on local roads, whereas this was 11% and 16% for the traditional grid and conventional subdivision, respectively (1). Obviously reducing traffic on local roads (where more people generally live) is a good thing. Safety can also be increased through the use of 3-way intersections over 4-way intersections. The Fused-grid tends to use 3-way intersections in a ratio of around 5:1 and overall has fewer intersections than the gridiron or even the conventional subdivision layout (3).   

Vehicular kilometers traveled per trip in the Fused-grid is not shorter than in the gridiron (this is expected) indicating that the Fused-grid is less connected <for vehicles> (1), but remember that it makes up for this through the use of central open spaces for pedestrians and cyclists. In fact, making driving inconvenient and active commuting more convenient and pleasant is the central premise of this layout. In the only epidemiological study of the Fused-grid, areas with a street pattern similar to the Fused-grid (high pedestrian connectivity and low vehicular connectivity) were found to have the highest percentage of people deciding to walk (18%) compared to areas with low pedestrian connectivity/low vehicular connectivity (10%), low pedestrian connectivity/high vehicular connectivity (10%), and high pedestrian connectivity/high vehicular connectivity (14%)(4). Another study further supported these findings (see Figure 2 below)(2). Additionally, the Fused-grid has been shown to slightly cut down on the average distance required to get to transit stops compared to subdivision layouts (3). 

Figure 2. Comparison of percentage of people walking, driving, and using public transit 
  between different neighbourhood street layouts, provided by F. Grammenos and adapted 
  from Jin, 2010

The Fused-grid layout appears to be highly flexible, which can increase the diversity of the area. For instance, the new Fused-grid neighbourhood in Calgary, Alberta, provides various housing density options including townhouses, apartments, and houses (5). The proposed density (10.5- 12.1 units per acre) was twice that of densities typically found in conventional subdivision layouts. Other studies also show that the Fused-grid has more developable land (60%) than the traditional gridiron (53%)(1), and can connect more easily to future development areas than the conventional subdivision (3), indicating a great deal of flexibility for future growth.  

Given the results thus far, the Fused-grid layout looks promising. However, some gaps remain. These mostly have to do with more intricate planning details that would probably be up to the developer to implement, as well as limited or facilitated by town/city by-laws. Some of these gaps could, on the other hand, be addressed in the layout itself. Recommendations to address these gaps are highlighted below:


Table 1. Recommendations to improve the population health impact of the Fused-Grid layout
1.General guidelines for planting of trees along streets, open areas and residential lots, as well as plans for landscaping of open spaces and common areas should be included in the layout. These plans should include spacing and orientation of trees with respect to buildings to provide efficient energy-reduction and protection from noise  
2.At a minimum, plans for proper lighting of pedestrian connectors as well as way-finding signage should be included. Pedestrian-scale lighting should be designed to adequately light sidewalks (in addition to lighting provided to increase motorists’ safety).  Points where pedestrians must cross vehicular streets should be well marked and easily visible to both motorist and pedestrian. Way-finding signage should point to crossings with the least pedestrian-motor vehicle conflict.
3.More common meeting spaces in the public realm need to be created to facilitate social interaction and physical activity. The routes to these spaces as well as the spaces themselves should make residents feel comfortable. The layout should also include the spatial layout of benches along streets and pedestrian pathways that face visually interesting backdrops (such as ponds, gardens, main streets, etc). The placement of these meeting and resting places should ensure that shade and wind protection are provided
4.Guidelines for designing bike lanes along lower traffic volume streets and/or mixed-use pathways, separate from the road system, should be included. At present, getting to a destination efficiently depends on where one starts within the neighbourhood quadrant.  Providing extra pathways can improve route directness, thereby decreasing travel time. At least one sidewalk per street should also be provided.
5.The plan layout should provide extra areas of mixed land-use within neighbourhood districts (within the four quadrants) and promote mixed building use to commercial developers.  
6.Guidelines should be provided on how to efficiently maximize diversity within the development (or neighbourhood to be retrofitted) in terms of building types and density. Providing rental units in single family homes should be encouraged. The Calgary developer has done this by introducing optional units with an accessory apartment.
7.The layout should strive to minimize impermeable (non-absorptive) surfaces, consider increasing lot size, and provide, not only a centralized green space for connectivity, but also small pockets of green space throughout the area - to improve rainwater management - a previous study did not show that the Fused-grid was any better than the traditional gridiron layout in this regard (6). The Calgary developer constructed rain gardens in each of the open spaces to improve rainwater management (5).


All in all, the Fused-grid layout is a progressive concept that appears to capitalize on the benefits of both the traditional gridiron and conventional subdivision neighbourhood layouts. Further research is needed - as I discussed before - to determine if changing a community to fit the Fused-grid layout (or moving people into a Fused-grid neighbourhood) results in changes to behaviours and perceptions, traffic-related injuries and levels of obesity among residents. This is hard to do, but at the very least I think that future research on the Fused-grid would benefit immensely from incorporating some form of epidemiological method in addition to methods used in the geography and planning literature.  

References
1. Grammenos F. (2008). Taming the flow - Better traffic and safer neighbourhoods Canada Mortgage and Housing Corporation Research Highlights, Report No.: 08-012.
2. Jin X (2010). Modelling the influence of neighbourhood design on daily trip patterns in urban neighbourhoods Doctoral Thesis Dissertation, Memorial University, Newfoundland
3. Grammenos F., & Gregory K. (2004). Applying Fused-Grid planning in Stratford, Ontario Canada Mortgage and Housing Corporation Research Highlights, Report No.: 04-038
4. Grammenos F., Frank L., & Hawkins C. (2008). Giving pedestrians an edge - Using street layout to influence transportation choice Canada Mortgage and Housing Corporation Research Highlights, Report No.: 08-013
5. Grammenos F. (2008). Breaking ground: A fused grid neighbourhood in Calgary Canada Mortgage and Housing Corporation Research Highlights, Report No.: 08-020
6. Grammenos F., & Pollard D. (2007). A plan for rainy days: Water runoff and site planning Canada Mortgage and Housing Corporation Research Highlights, Report No.: 07-013ResearchBlogging.org

Saturday, February 26, 2011

Street layout and connectivity - how is that related to sustainability and obesity prevention?

This week’s post discusses connectivity - how easy is it for you to get from point A to be B on foot or by bicycle in your community? This follows nicely from last week’s post on compactness and diversity and will sum up the series on sustainability and obesity prevention.  Now equipped with this bit of background info, we will be better able to determine which community design options, like the Fused Grid, are better for sustainability, and possibly for our waistlines and overall health.  

As I highlighted before, suburban loop and lollipop neighbourhoods are confusing and time-consuming to navigate. They often preclude walking anywhere because of their design; there is never a short, straight line route to where you want to go. In these types of designs there are very few intersections, which are said to increase <driver> safety. However, as the number of intersections increases, the shorter the distance there is to walk from point A to B (motivating people to actively commute), and the more routes you have to choose from, making the walk/ride more interesting (also motivating). 

Walking distances for the loop/lollipop design versus traditional grid

To increase the connectivity of subdivisions, some features discussed in the post on safety could be added, such as way-finding signage for ‘cat-walks,’ as well as adding pedestrian and bike trails through green space, which link different areas within the neighbourhood or the wider community.

Adding biking infrastructure can increase the connectivity over larger areas. I find this especially important for me as I strive to actively commute to work from Aylmer to Ottawa. The National Capital Region is better than many places; we have separate pedestrian/biking pathways and some shared road bike lanes. The City of Ottawa is even planning to pilot a segregated bike lane on Laurier street. Overall, though I find though that the infrastructure is discontinuous and more geared to the leisure walker/biker, not the commuter. For example, you take a bike pathway and suddenly find yourself on the road going the wrong way on a one-way street. Or you have to decide between taking a separate, safer bike pathway that follows the meandering river, or take a direct, much faster, but less safe route that uses the roadway.    

The relationship between physical activity/obesity and measurements of street connectivity, such as intersection density and block size, has not been clearly demonstrated in the scientific literature (1-3). However when these measures are incorporated into an overall walkability index that generally includes land-use mix and residential density, more walkable neighbourhoods (with higher intersection density, more mixed land-use, and higher residential density) have been found to relate to decreased obesity among adults (2).

Few studies have been conducted on children, although one study in Alberta found that girls living in highly walkable neighbourhoods were less likely to be overweight than girls in less walkable neighbourhoods, with no difference found among boys (4). Another study in the U.S. did not find a significant relationship between obesity and street connectivity, but did find that children living in neighbourhoods built after 1969 (curvilinear, suburban design) were more likely to be obese than children living in neighbourhoods built before 1970 (traditional, grid iron design with small blocks and lots of intersections)(5).

There is some evidence, as has been discussed in previous posts, that changing the design of the built environment (specifically with regard to increasing safety and mixed land-use) can increase physical activity (this is akin to an experiment)(6). Interestingly, there is also some evidence that improving cycling networks in cities and towns modestly increases cycling (7). However, it is difficult to determine if this results in more new riders or more trips taken by existing riders; the former being much better from a public health perspective. Unfortunately, there are very few studies that examine how changes in neighbourhood/street layout can lead to later changes in physical activity or obesity. Perhaps because randomizing people and telling them where to live is a difficult thing to do. Nonetheless, some researchers are getting around this problem with novel study designs - hopefully with results coming soon.   

On-street marking and separating bike lanes in Manhattan, picture from Active Design Guidelines, NYC
     
As I discussed in a previous post, the Centers for Disease Control and Prevention in the U.S. conducted a comprehensive review with the goal of developing recommendations for childhood obesity prevention at the community-level (8).  Related to increasing street connectivity, the report recommended that communities should:

  1. Enhance infrastructure supporting bicycling and walking;
  2. Enhance personal safety in areas where persons are or could be physically active;
  3. Enhance traffic safety in areas where persons are or could be physically active.
Increasing connectivity at the street, neighbourhood, and town/city level may get people out walking or biking for transport or pleasure, especially if the area is compact and diverse. Overall, though, I would argue, that if our spaces are aesthetically pleasing, safe, compact, diverse AND connected, we would be most likely to be active for transport or pleasure, which  increases the sustainability of the area and can help to keep excess weight in check. A great new resource that I stumbled upon from NYC highlights exactly what I have been talking about over these last 4 posts + the introductory post on sustainability. It also goes a whole lot further, showing how to design buildings to increase physical activity, where to build, and increasing access to public transit and healthy food options, to name a few. It's free to download.


References


  1. Saelens BE & Handy SL. Built environment correlates of walking: A review. Medicine & Science in Sport Exercise. 2008; 40(7S): S550-66 http://www.ncbi.nlm.nih.gov/pmc/articles/PMC2921187/
  2. Feng J et al. The built environment and obesity: A systematic review of the epidemiologic evidence. Health&Place. 2010; 16: 175-90 
  3. Carter MA & Dubois L. Neighbourhoods and child adiposity: A critical appraisal of the literature. Health&Place. 2010; 16: 616-28 
  4. Spence, J. C. et al. Influence of neighbourhood design and access to facilities on overweight among preschool children. International Journal of Pediatric Obesity. 2008; 3: 109-116.
  5. Grafova, I. B. Overweight children: assessing the contribution of the built environment. Prev Med. 2008; 47: 304-308.
  6. Heath GW et al. The effectiveness of urban design and land use and transport policies and practices to increase physical activity: A systematic review. Journal of Physical Activity and Health. 2006; 3 Suppl 1; S55-76 http://www.aapca3.org/resources/archival/060306/jpah.pdf
  7. Yang L et al. Interventions to promote cycling: systematic review. BMJ. 2010; 341:c5293 http://www.bmj.com/content/341/bmj.c5293.full
  8. Khan LK et al. Recommended Community Strategies and Measurements to Prevent Obesity in the United States. Morbidity and Mortality Weekly Report. 2009; 58(RR-7) http://www.cdc.gov/mmwr/preview/mmwrhtml/rr5807a1.htm


Friday, February 18, 2011

Compact and diverse communities: sustainable and obesity preventive?

This is the third post in the series – ‘Sustainable community design and obesity prevention;’ only one more to go. Today I will obviously be discussing how compact and diverse areas can influence our waistlines. 

It makes sense that for neighbourhoods to be liveable (enjoyable, sustainable, useable, etc.) there must be interesting and necessary amenities accessible within easy walking distance.  Although there are differing views as to the meaning of ‘easy walking distance,’ I am referring here to destinations that are accessible in about 10 minutes or so – about 1 km, or the distance of a traditional city block.

These amenities should include banks, schools, restaurants/pubs, cafes, shopping, grocery and corner stores, parks and open spaces, and meeting places such as courtyards and piazzas.  The term ‘mixed land-use’ refers to the mixing of residential, commercial, and institutional uses. This makes neighbourhoods and the broader community more compact, as well as diverse. 

In an ideal world, I would live in an area where I could access all amenities, as well as my job, on foot.  Right now, according to www.walkscore.com, I live in a ‘car-dependent’ neighbourhood – scoring an abysmal 27/100. Curiously downtown Hull, QC (close to my home) seems to do pretty well, although I’m not convinced the site takes into account whether anyone actually lives there (e.g. downtown Hull is mostly government buildings).  In the better weather, I have to ‘force’ myself to bike the 12 km into work and back home.  Although I am no marathon runner, I consider myself to be in fairly decent shape, so assuming the average person would commute 24 km round trip by bike each day is not feasible (and I don’t even actively commute each and every day); obviously the walk is impossible and public transportation is a bit annoying.


Among adults, the general finding in the scientific literature is that mixed land-use, high density, and low sprawl (different measures that take into account density, degree of mixed land-use, block size, etc) are associated with increased walking (1), and a decreased probability of obesity (2) and high blood pressure among area residents (3). Mixed-use zoning alone can dramatically increase physical activity; a review of 12 studies showed that the median improvement in the level of physical activity was 161% (4).  In children, the association between compactness and weight is less clear and reflects, at least partly, a lack of similar studies with which to compare results (5).

The Centers for Disease Control and Prevention in the U.S. conducted a comprehensive review with the goal of developing recommendations for childhood obesity prevention at the community-level (6).  Included in the recommendations were:

  • Support for locating schools within easy walking distance of residential areas 
  • Zoning for mixed-use development

Compact, diverse neighbourhoods and communities are more liveable and likely more healthy, but can we afford to live in these places?  More people living in one area make amenities viable but that also increases land value.  How do we build or retrofit these communities, simultaneously making them profitable for developers/cities and equitable for all residents?  


References
  1. Saelens BE & Handy SL. Built environment correlates of walking: A review. Medicine & Science in Sport Exercise. 2008; 40(7S): S550-66 http://www.ncbi.nlm.nih.gov/pmc/articles/PMC2921187/ 
  2. Feng J et al. The built environment and obesity: A systematic review of the epidemiologic evidence. Health&Place. 2010; 16: 175-90 
  3. Leal C & Chaix B. The influence of geographic life environments on cardiometabolic risk factors: A systematic review, a methodological assessment and a research agenda. Obesity Reviews. 2010; March 1. 
  4. Heath GW et al. The effectiveness of urban design and land use and transport policies and practices to increase physical activity: A systematic review. Journal of Physical Activity and Health. 2006; 3 Suppl 1; S55-76  http://www.aapca3.org/resources/archival/060306/jpah.pdf 
  5. Carter MA & Dubois L. Neighbourhoods and child adiposity: A critical appraisal of the literature. Health&Place. 2010; 16: 616-28 
  6. Khan LK et al. Recommended Community Strategies and Measurements to Prevent Obesity in the United States. Morbidity and Mortality Weekly Report. 2009; 58(RR-7)  http://www.cdc.gov/mmwr/preview/mmwrhtml/rr5807a1.htm

Thursday, February 10, 2011

Sustainable community design and obesity prevention: Implications for increasing safety

Today’s post, discusses the implications of neighbourhood safety, which was briefly touched on in the previous post on aesthetics. I should highlight here that when I refer to safety, I am including both objective (measured, say with crime or traffic accident statistics) and subjective forms (as perceived by residents themselves). 

In order for communities (neighbourhoods or whatever synonym you would like to use) to be sustainable, they should not be environments in which residents are unable to experience all that the community has to offer, either because they live in fear of getting injured or killed, or are actually more likely to get injured or killed when out and about.

Some studies in the scientific literature have found that unsafe neighbourhoods discourage adult residents from walking – specifically lack of sidewalks (1).  This is a huge problem in my neighbourhood where only main arterial roads have sidewalks on each side. Among children, a Canadian study (Nova Scotia) linked increased parental perceived neighbourhood safety to increased participation in unorganized sports (2). Another study in Australia that followed the same children over time (a ‘longitudinal’ or ‘cohort’ study), found that parental concerns with traffic deterred moderate-to-vigorous physical activity among boys, but not girls (3). However, girls' own concerns with road safety was cross-sectionally related to decreased physical activity levels (4).


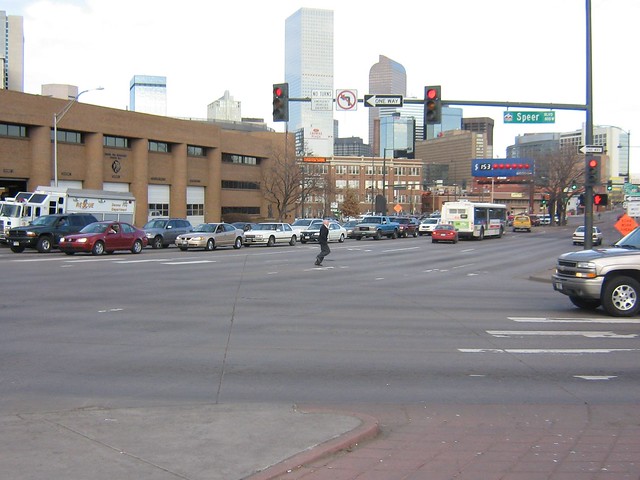
A pedestrian dashes across a huge intersection in Denver (Photo credit: 'Complete Streets')


In terms of obesity, few studies focusing specifically on neighbourhood safety have been conducted. One longitudinal study on children uncovered an influence of parental perceived neighbourhood safety on BMI that appeared to be mediated by increased TV watching. In other words, the results indicate that parents may restrict their children's outdoor physical activity if they perceive the neighbourhood to be unsafe, which translates into increased sedentary behaviours (TV watching in this case) and then increased BMI (5). 
   
Based on a review by Heath et al, changing urban design and land-use policies may be effective at increasing the physical activity levels of neighbourhood residents (6). The six intervention studies that they reviewed generally centred on redesigning the environment at the street-scale to make walking and biking more enjoyable and safe (examples include improved street lighting, traffic calming, and enhancement of street aesthetics). The median increase in physical activity across the studies was 35% (inter-quartile range of 16% - 62%).  

The list below highlights ways communities can potentially increase real or perceived safety. It is a compilation from various sources in the research, public health, and urban planning sectors (1,6-8)  . Hopefully more rigorous studies of their effects on residents, in terms of increasing physical activity and decreasing obesity, are soon to come:

    Traffic calming techniques (to slow down and/or discourage automobile traffic):
·         Widening sidewalks and narrowing width of streets 
·         Adding landscaping – i.e. trees lining the road, placed in between the sidewalk and the road (this can increase perception of safety by pedestrians). At the same time, landscaping should not obscure line of sight by both pedestrian and driver
·         Installation of speed humps
·         Altering road alignments
·         Adding traffic circles or pavement treatments
·         Removing vehicular rights of way (i.e. make dead end streets) but keeping pedestrian rights of way

    Ensuring adequate lighting along roadways and walkways (wherever pedestrians are likely to walk)

    Ensuring clear way-finding signage for pedestrians
·         Pedestrian crossing signs and marked crossing areas
·         Street names at the start/end of pedestrian walkways (i.e. ‘catwalks’ in subdivisions)

    Plowing of bike lanes and sidewalks in the winter time
·         This is especially problematic in Canada (see picture below and an interesting post on cycling in the winter by a fellow colleague - in French)

                         There is supposed to be a bike lane here - see the green sign? It's hardly ever
plowed in the winter (Stewart and Cumberland Streets, Ottawa Canada)

    Allowing adequate time for pedestrians to cross at traffic lights    

    Ensuring that at minimum, streets have sidewalks and a paved shoulder for cyclists. Although I'm sure cyclists would much prefer the establishment and maintenance of separate bike trails and more bike lanes on roadways 

    Creating ‘eyes upon the street’
·         Layout of residential areas
·         Building height and form

Certainly more research is needed on this topic, to relate changes in design, crime levels and overall perceptions of safety to changes in physical activity and obesity. Intuitively though, increasing the level of safety in areas where we live makes our spaces more enjoyable and useful, regardless if they have measurable impacts on our waistlines. 


References
  1. Saelens BE & Handy SL. Built environment correlates of walking: A review. Medicine & Science in Sport Exercise. 2008; 40(7S): S550-66 
  2. Veugelers P et al. Neighbourhood characteristics in relation to diet, physical activity, and overweight of Canadian children. International Journal of Pediatric Obesity. 2008; 3(3): 152-9 
  3. Crawford D et al. The longitudinal influence of home and neighbourhood environments on children's body mass index and physical activity over 5 years: The CLAN Study. International Journal of Pediatric Obesity. 2010; 34: 1177-87
  4. Carver A et al. Perceptions of neighbourhood safety and physical activity among youth: The CLAN Study. Journal of Physical Activity & Health. 2008; 5(3): 430-44
  5. Cecil-Karb R & Grogan-Kaylor A. Childhood body mass index in community context: Neighborhood safety, television viewing, and growth trajectories of BMI. Health & Social Work. 2009;34(3):169-77
  6. Heath GW et al. The effectiveness of urban design and land use and transport policies and practices to increase physical activity: A systematic review. Journal of Physical Activity and Health. 2006; 3 Suppl 1; S55-76
  7. Institut National de Santé Publique du Québec. Indicateurs géographiques de l'environnement bâti et de l'environnement des services influant sur l'activité physique, l'alimentation et le poids corporel. 2009. Available at: http://www.inspq.qc.ca/pdf/publications/1001_IndGeoEnvBati.pdf
  8. Dempsey N. Quality of the built environment in urban neighbourhoods. Planning, Practice & Research. 2008; 23 (2): 249-64